


Vibration analysis plays a key role in structural engineering and dynamic testing by helping researchers understand how materials and components respond to dynamic loads. In this case study, we apply MercuryRT’s 3D DIC and Vibrography module to analyze the behavior of a tuning fork after an impact. The goal is to extract full-field displacement data and confirm the fork’s operational mode shape.
To analyze the vibration response and confirm the operational mode shape of a tuning fork using Digital Image Correlation (DIC) and extract the Operational Deflection Shapes (ODS).
The test specimen was a standard tuning fork with a nominal operational frequency of 256 Hz. The field of view was approximately 250 × 180 mm. The setup involved a 3D high-speed DIC system consisting of:
❖ Excitation Source: Rubber ball hammer (tuning fork activator)
❖ Cameras: Two synchronized Chronos 2.1 high-speed cameras
❖ Resolution: 1920×1080 pixels
❖ Frame Rate: 1,000 FPS
❖ Calibration Grid: 5 mm
❖ Lighting: 2x Blue LED lights
❖ Lenses: 35 mm, 400 mm working distance
❖ Software: MercuryRT with 3D DIC and Vibrography module
❖ Full-field displacement in the X axis was the primary obtained value.
The vibration analysis was conducted using the following step-by-step procedure within the Mercury RT environment:
❖ Real-Time scene preparation – the specimen was prepared by applying 2 layers of matte acrylic white paint as the background and an acrylic matte black paint was used for the speckles. The speckle pattern has been analysed by the Focus Tool software function and evaluated by our pattern assessment. The cameras were calibrated in real-time using a 5 mm calibration grid which also helped set a custom coordinate system with the X axis representing a horizontal line and the Y axis representing the vertical line. This setting of the coordinate system allows us to focus on the analysis in the X axis – the movement of the pitchforks happens in this direction.
❖ Image acquisition – Our High-Speed Capture Tool feature was used to capture 5 000 frames. The data saved in the camera’s buffer is transferred to our software via an Ethernet connection, making the frames download fast.
❖ Deflection rendering – Upon analysis full-field displacement data, the Vibrography tool was used to render the frequency spectrum. This spectrum has shown two peak frequencies of the measurement. At both selected frequency, Mercury RT visualized the deflection shape of the full-field area.
❖ Dynamic animation – To make small vibrations and/or displacements visible, Mercury RT can amplify the magnitude of the measured deflections. It can also speed up the shape’s movement to make the shape visually clear to the user.
This data was used for the vibrography analysis – effectively breaking down the vibration signal using FFT into a frequency spectrum.
The spectrum shows two peaks of amplitude – at a frequency of 71,7 Hz and 256,6 Hz.
The deflection shapes at these frequencies look as follows:
❖ ODS 72 Hz
❖ ODS 256 Hz
The response at 256,6 Hz is expected – it is the operating frequency of the tuning fork. However, the peak at 71,7 Hz was unexpected, therefore we performed a further analysis to determine the cause of this.
Using our Subset function, the frequency spectrum was displayed for parts of the measurement at the time.
It is visible that in the first half of the measurement, the dominant frequency is the unexpected one. In the second half of the measurement, the dominant frequency is the operating frequency of the tuning fork.
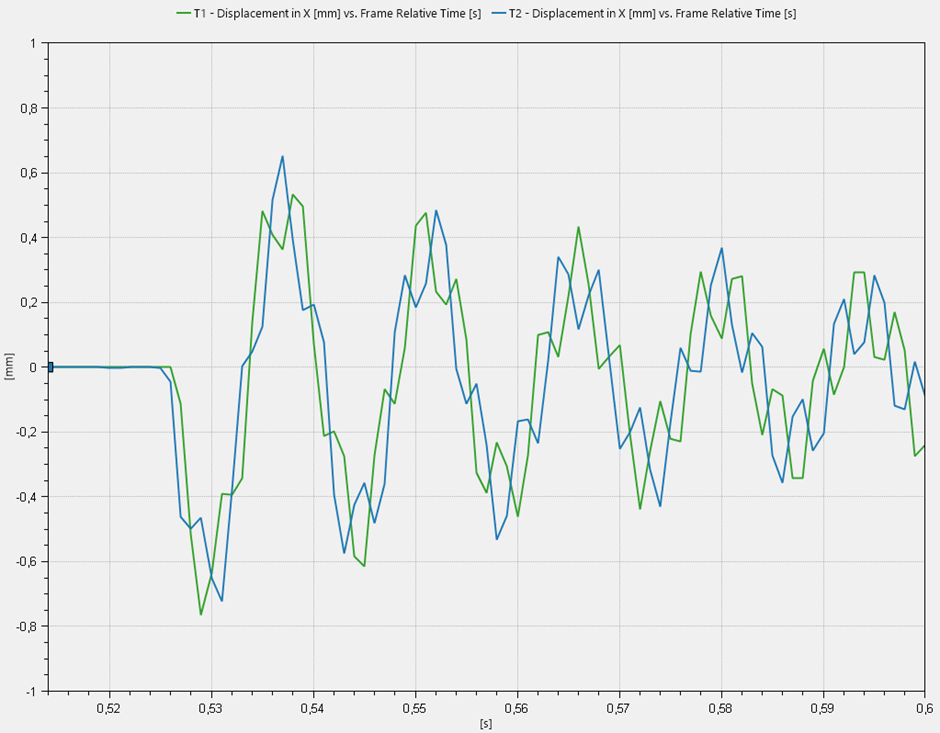
Further analysis was conducted using Point Probes placed at both pitchforks.
The displacement was tracked for both pitchforks separately.
In the first half of the measurement, we can see that the pitchforks move in the same phase. As the impact is dampened down, the tuning fork is stabilizing at its operational frequency, and the phase of the pitchforks is opposite for the second half of the measurement.
It has been evaluated that the unexpected frequency of 71,7 Hz is a response to the impact where both pitchforks move in the same phase while the operating frequency 256,6 Hz is a natural frequency of the fork where the pitchforks move in the opposite phase.
❖ Non-contact, full-field measurement of displacement and strain, eliminating the need for physical sensors on the specimen.
❖ Accurate identification of multiple vibration modes and phase relationships.
❖ Detailed frequency domain analysis, such as amplitude/phase graphs, Campbell diagrams, and animated ODS enhance engineering insight.
❖ Subset analysis to isolate specific time windows and dynamic transitions.
❖ High-speed compatibility with synchronized cameras for capturing rapid vibrations.
This study highlights how MercuryRT’s 3D DIC and Vibrography tool provide powerful insights into the vibrational behavior of the tuning fork. The non-contact, high-resolution measurement approach makes it ideal for analyzing parts under operational stress.
For more information about 3D DIC and Vibrography, please Contact us through email info@mercury-dic.com.
We’ll install your measurement system and help you solve your measurement problems. Our software and application engineers are here to help!